Cyprus Investment Funds Statistics – February, 2020
The Statistics Department of the Central Bank of Cyprus (CBC) released its February 20th, 2020 statistics update for Investment Funds based in Cyprus.
The statistics are presented into the following 5 tables:
1. Investment funds balance sheet data: assets,
2. Investment funds balance sheet data: liabilities,
3. Investment funds total assets/liabilities, by nature of investment,
4. Investment funds total assets/liabilities, by type of investment fund,
5. Investment funds total assets/liabilities, UCITS/Non-UCITS breakdown.
The reporting frequency is quarterly, and the current data set period includes data until the end of December 2019. This set of data effectively represents the progress of the funds industry in Cyprus during the year 2019.
The Investment funds balance sheet data: assets table
The total assets outstanding at the end of December 2019, were reported at 6,093.6 million EUR. This is four times the total assets reported 9 years ago, at the end of December 2010 of 1,490.4 million EUR – an increase of 308.86%. The statistics reported by CBC show a consistent trend of growth in total assets in Investment Funds in Cyprus in the past 2 years, except for a drop of 1.4% in the period ending December 2018.
The data on the number of reporting entities validate this trend of growth with a consistent positive increase reported in the last 9 quarters, quarter-over-quarter. Many of the reporting entities are Alternative Investment Funds (AIF) and Registered Alternative Investment Funds (RAIF). This growth trend has resulted in 178 entities at the end of 2019 from 149 at the end of 2018 – an increase of 19.46%. Out of these 29 entities, 19 are RAIF (Registered Alternative Investment Funds). Taking into consideration that RAIF were introduced by CySEC in mid-to-late 2018, their representation as two thirds of the total of new regulated entities within 2019, is noteworthy.
Figure 1 below, combines these 2 data sets with
– the y-axis on the left and the bars along the x-axis showing the Total Assets in EUR million, outstanding,
– the y-axis on the right and the line along the x-axis showing the Number of Reporting Entities,
at the end of each period.
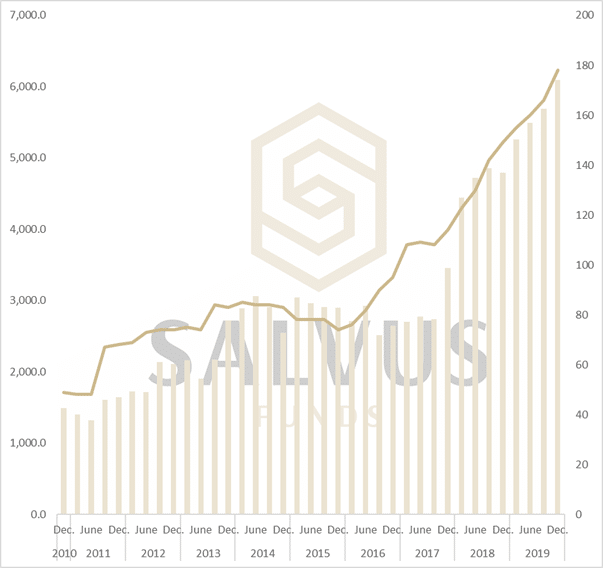
Figure 1 – The progress of Total Assets in EUR million (bars), outstanding at end of period and the Number of Reporting Entities (line) since end of December 2010 until end of December 2019.
The increase of 1,302.62 million EUR, during the year 2019 – an increase of 27.19% – was the result of a positive quarter-over-quarter increase throughout the whole year. It is the second highest yearly increase in the last 11 years. Figure 2 below, shows the amount by which the total assets outstanding at the end each year, increased or decreased. The last 3 years have seen the highest increases, with the increase in the last 2 years combined (2,641.72 million EUR) surpassing the increase in the previous 9 years combined (2,176.70 million EUR).
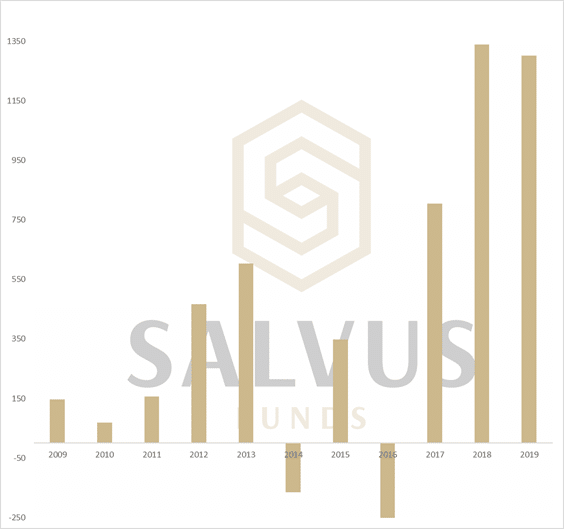
Figure 2 – The increase or decrease amount for the Total Assets Outstanding at the end of each year in million EUR.
The Investment funds balance sheet data: liabilities table
The breakdown of the liabilities on the balance sheet of Investment Funds in Cyprus is reported in 3 categories by the CBC:
1. Loans
2. IF (Investment Funds) shares/units
3. Other liabilities (incl. financial derivatives)
Most liabilities are coming from IF shares/units, a consistent theme, with 5,232.1 EUR million outstanding at the end of the period (December 2019) amounting to 85.86% of the total liabilities of Investment Funds in Cyprus. Loans follow with a reduced quarter-over-quarter 685.8 EUR million outstanding (11.25%) and finally, other liabilities (incl. financial derivatives) amount to 175.7 EUR million outstanding (2.88%).
The Investment funds total assets/liabilities, by nature of investment table
The breakdown by nature of investment of the assets/liabilities on the balance sheet of Investment Funds in Cyprus is collected in 5 categories (Figure 3) by the CBC:
1. Equity
2. Bond
3. Mixed
4. Real Estate
5. Other
Compared to the end of the previous period (September 2019), Equities, Mixed and Other, recorded an increase while Bonds and Real Estate recorded a decrease. The two smallest classes, Bond and Real Estate, reported a drop at -6.77% and -0.99% respectively.
The biggest asset class, Equity, reported the biggest increase in both percentage terms, 14.08%, and outstanding amount terms, 308.2 EUR million. The total outstanding at 2,497.8 EUR million is a record high, surpassing the record held in 2014. Also, this increase, in percentage, terms is 2nd biggest in the last 5 years (second to 20.12% at the end of March 2019).
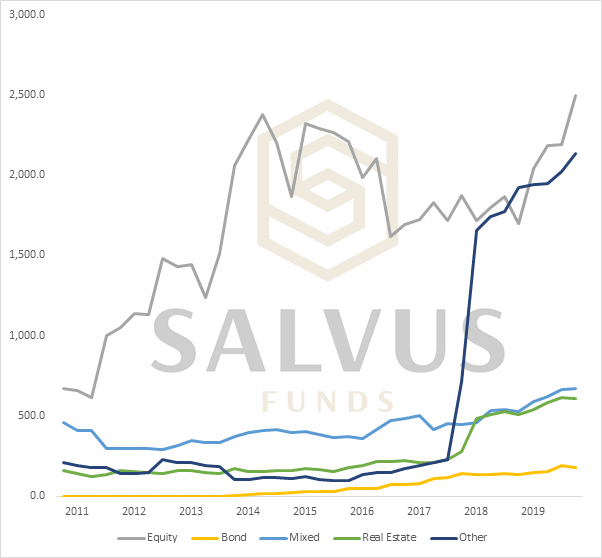
Figure 3 – The progress of total assets/liabilities in EUR million (bars), outstanding at end of period broken down by nature of investment.
The Investment funds total assets/liabilities, by type of investment fund table
The type of investment funds is split into Open End and Closed End.
The last time the Closed End type were representing the majority of investment funds in Cyprus, was back in 2012. As shown in Figure 4, the Open End type has ever since been the choice of fund managers, recording higher highs, while Closed End has clearly fallen out of favour.
The increase for Open end Investment Funds total assets/liabilities during 2019 was recorded at 28%.
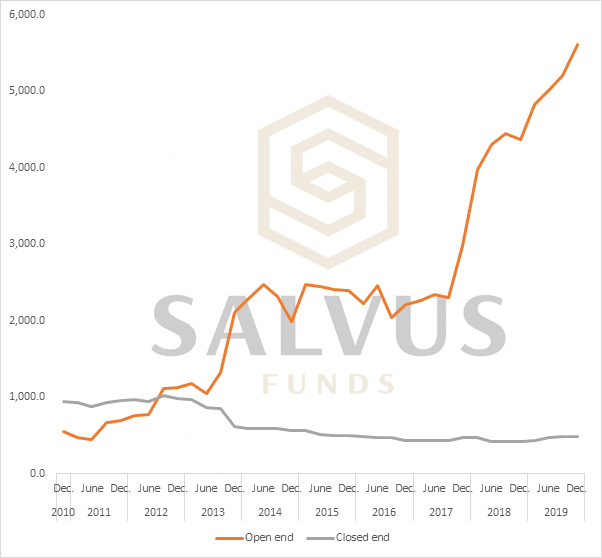
Figure 4 – The progress of the total assets/liabilities in EUR million (bars), outstanding at end of period broken down by type of investment fund.
The Investment funds total assets/liabilities, UCITS/Non-UCITS breakdown table
The final table of the Investment Funds Statistics as reported by CBC shows total assets/liabilities for both, UCITS and Non-UCITS investment funds, growing. The size of total asset/liabilities outstanding shows that the gap between them is consistently widening.
At the end of December 2019, total assets/liabilities for UCITS amounted to 358.6 EUR million outstanding while for Non-UCITS, the total assets/liabilities were reported at 5,735 EUR million outstanding.
Conclusion
Cyprus has had a very strong 2019 and its position as an investment funds jurisdiction, is reinforced one quarter at time – as the number testify every quarter. While upcoming changes such as the Mini-Manager law, further improvements in the AIFM, UCITS, and Partnership Law and the introduction of the law for the Fund Administrators are still expected, the country is on the right path.
The key stakeholders such as CySEC and CIFA, the Funds service providers and other organisations pursuing initiatives in this direction are seeing results. Along with the newly formed AIF, RAIF and AIFM, as SALVUS, we welcome and anticipate this virtuous cycle of growth to continue. We remain committed to contributing further.
The information provided in this article is for general information purposes only. You should always seek professional advice suitable to your needs.

