Cyprus Investment Funds Statistics – December 2023
On the 16th of February 2024, the Statistics Department at the Central Bank of Cyprus (CBC) released the latest statistics update concerning the investment funds industry in Cyprus. The CBC’s investment funds statistics report covers the fourth quarter (Q4) of 2023.
The SALVUS Investment Funds team regularly publishes an article such as this one to demonstrate the Cypriot investment funds statistics for the previous quarter in a digestible manner. Throughout the summary, our team highlights the key trends within the sector.
Throughout this article, our Investment Funds team present the statistics in more depth through the sections below:
1. Investment Funds balance sheet data: assets,
2. Investment Funds balance sheet: liabilities,
3. Investment Funds total assets/liabilities, by nature of investment,
4. Investment Funds total assets/liabilities, by type of investment fund,
5. Investment Funds total assets/liabilities, UCITS/Non-UCITS breakdown.
We regularly share bite-sized insights on LinkedIn such as those found in this article
1. The investment funds balance sheet data: assets table
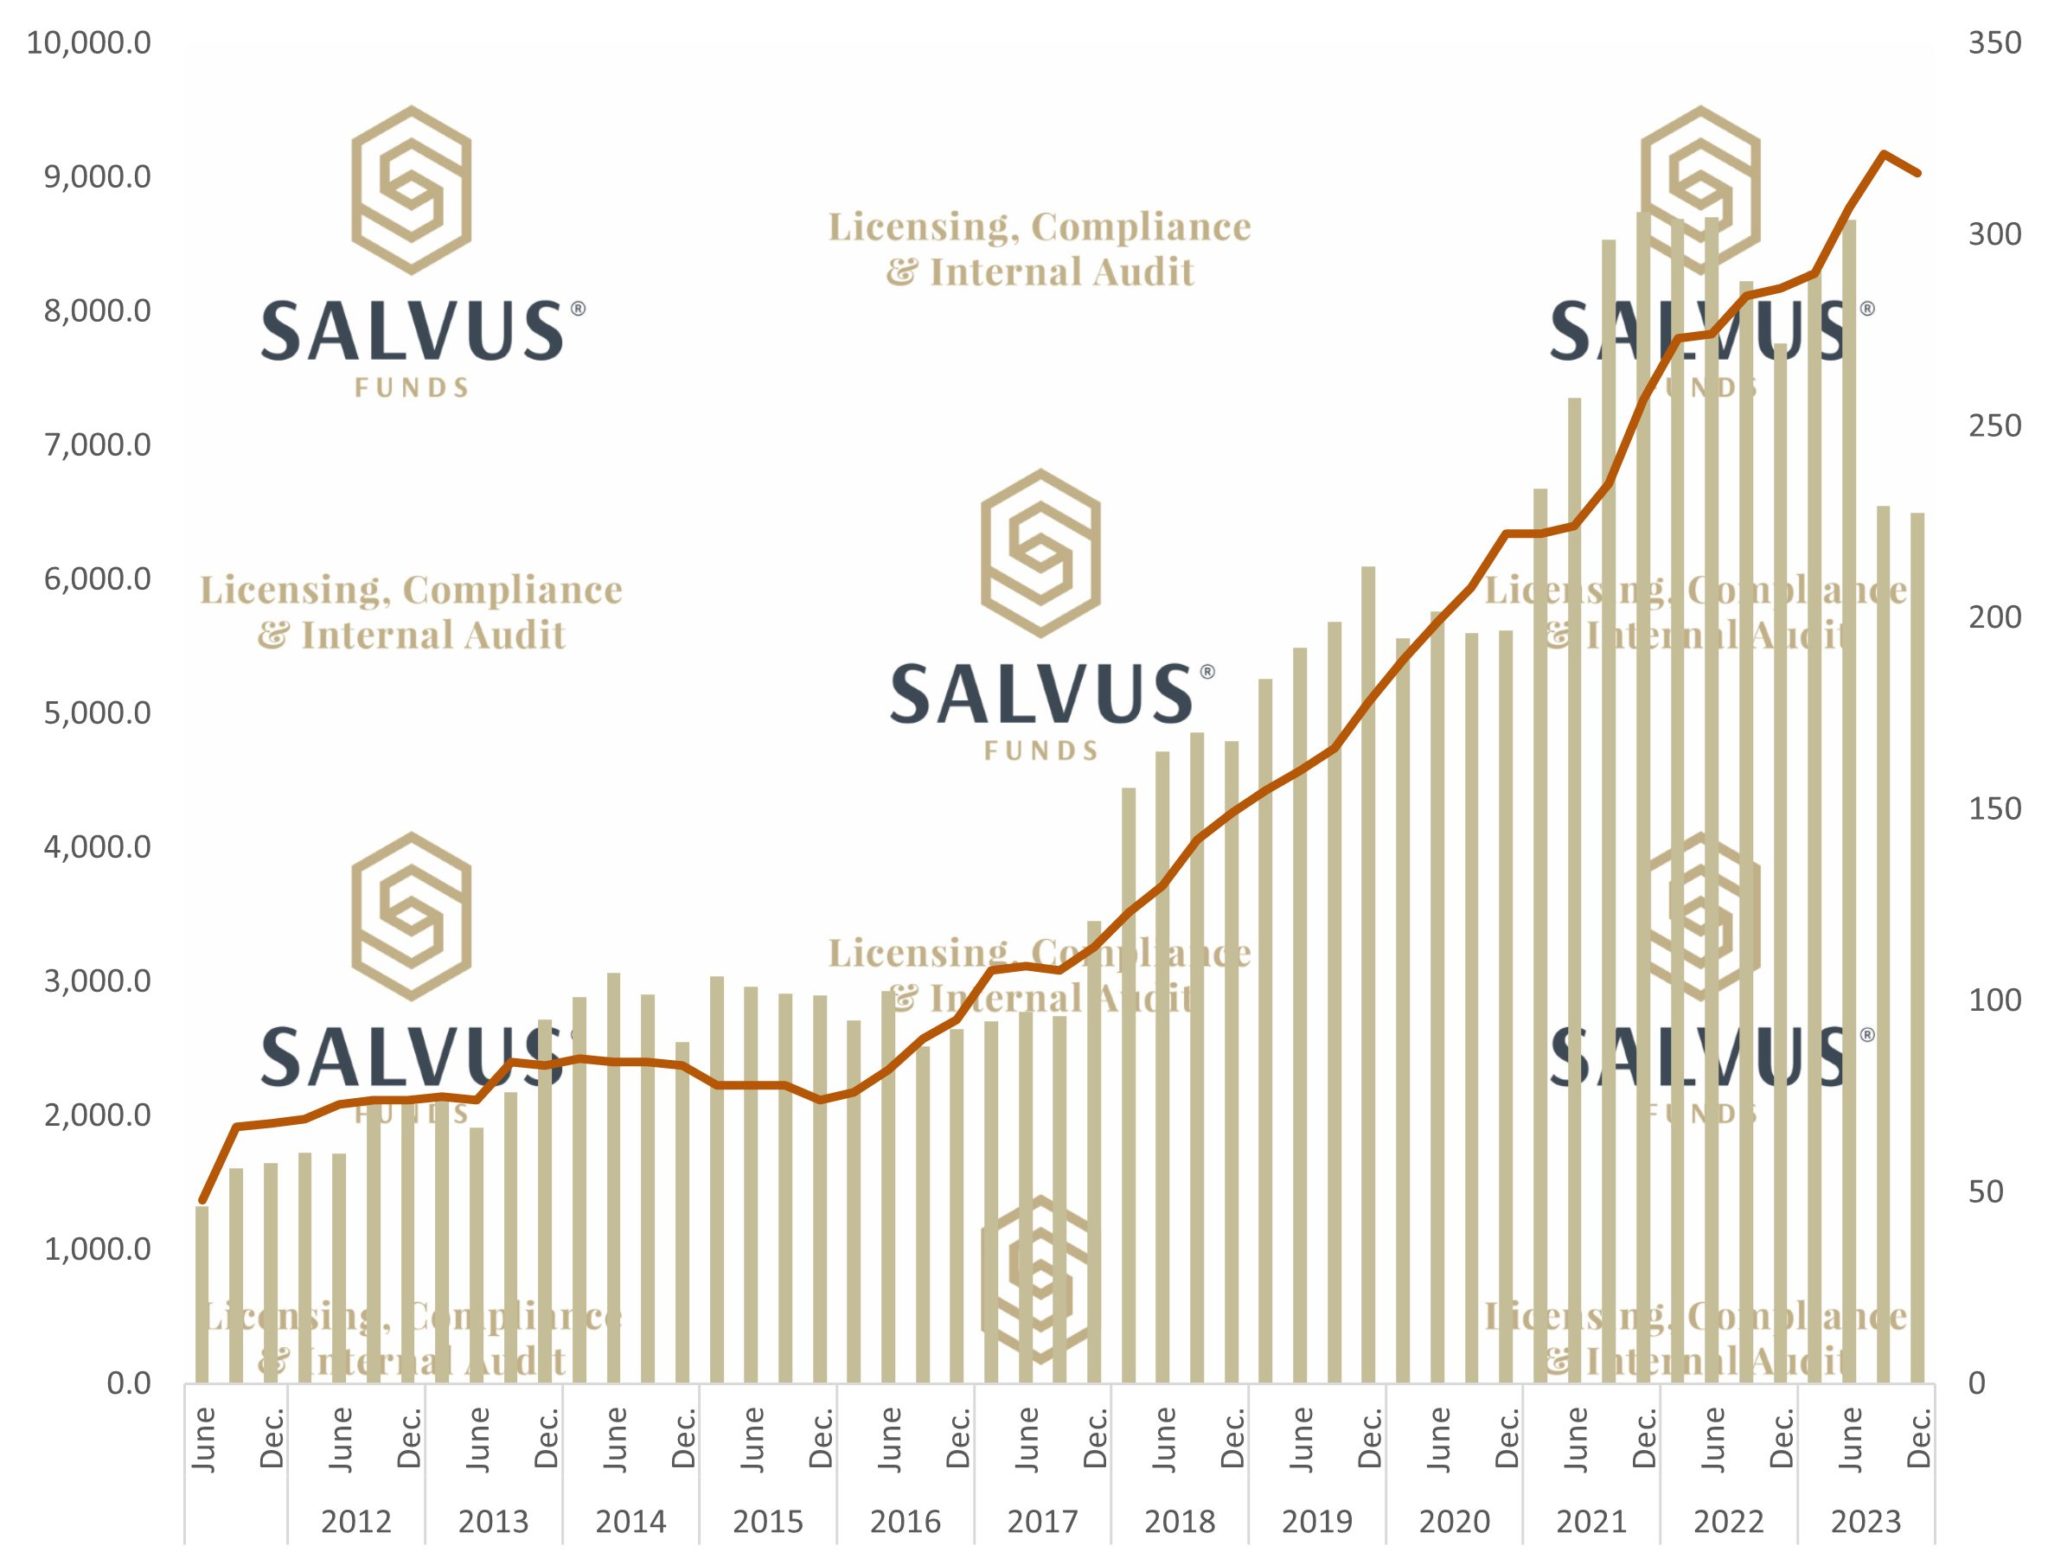
At the end of December 2023, the CBC reported the total assets outstanding for the investment funds industry in Cyprus at 6,495.5 million EUR. This represents a 0.84% decrease and is a second consecutive decrease from the total assets reported at the end of June 2023 which was reported at 8.685.7 million EUR. The latest report represents the lowest total assets number since the end of December 2020. Moreover, for the first time in over 6 years, the number of reporting entities decreased quarter-over-quarter, falling to a total of 316 reporting entities – 5 less than previously reported at the end of September 2023.
Figure 1 below, combines the 2 aforementioned data sets with
- the y-axis on the left and the gold bars along the x-axis showing the Total Assets in EUR million, outstanding,
- the y-axis on the right and the red line along the x-axis showing the Number of Reporting Entities, at the end of each period

Figure 1 – The progress of Total Assets in EUR million (bars), outstanding at the end of the period and the Number of Reporting Entities (line) from the end of June 2011 until the end of December 2023.
2. The investment funds balance sheet data: liabilities table
In the next section, the CBC uses 3 segments to categorise the liabilities on the balance sheet of the investment funds in Cyprus:
- Loans
- IF (Investment Funds) shares/units
- Other liabilities (incl. financial derivatives)
IF shares/units have continuously dominated the liabilities of Cypriot investment funds and it is no different this time around either. IF shares/units contribute to 96.38% of the total liabilities. Loans and Other liabilities (incl. financial derivatives) make up the remainder of the total liabilities with 1% and 2.62%, respectively.
3. The investment funds total assets/liabilities, by nature of investment table
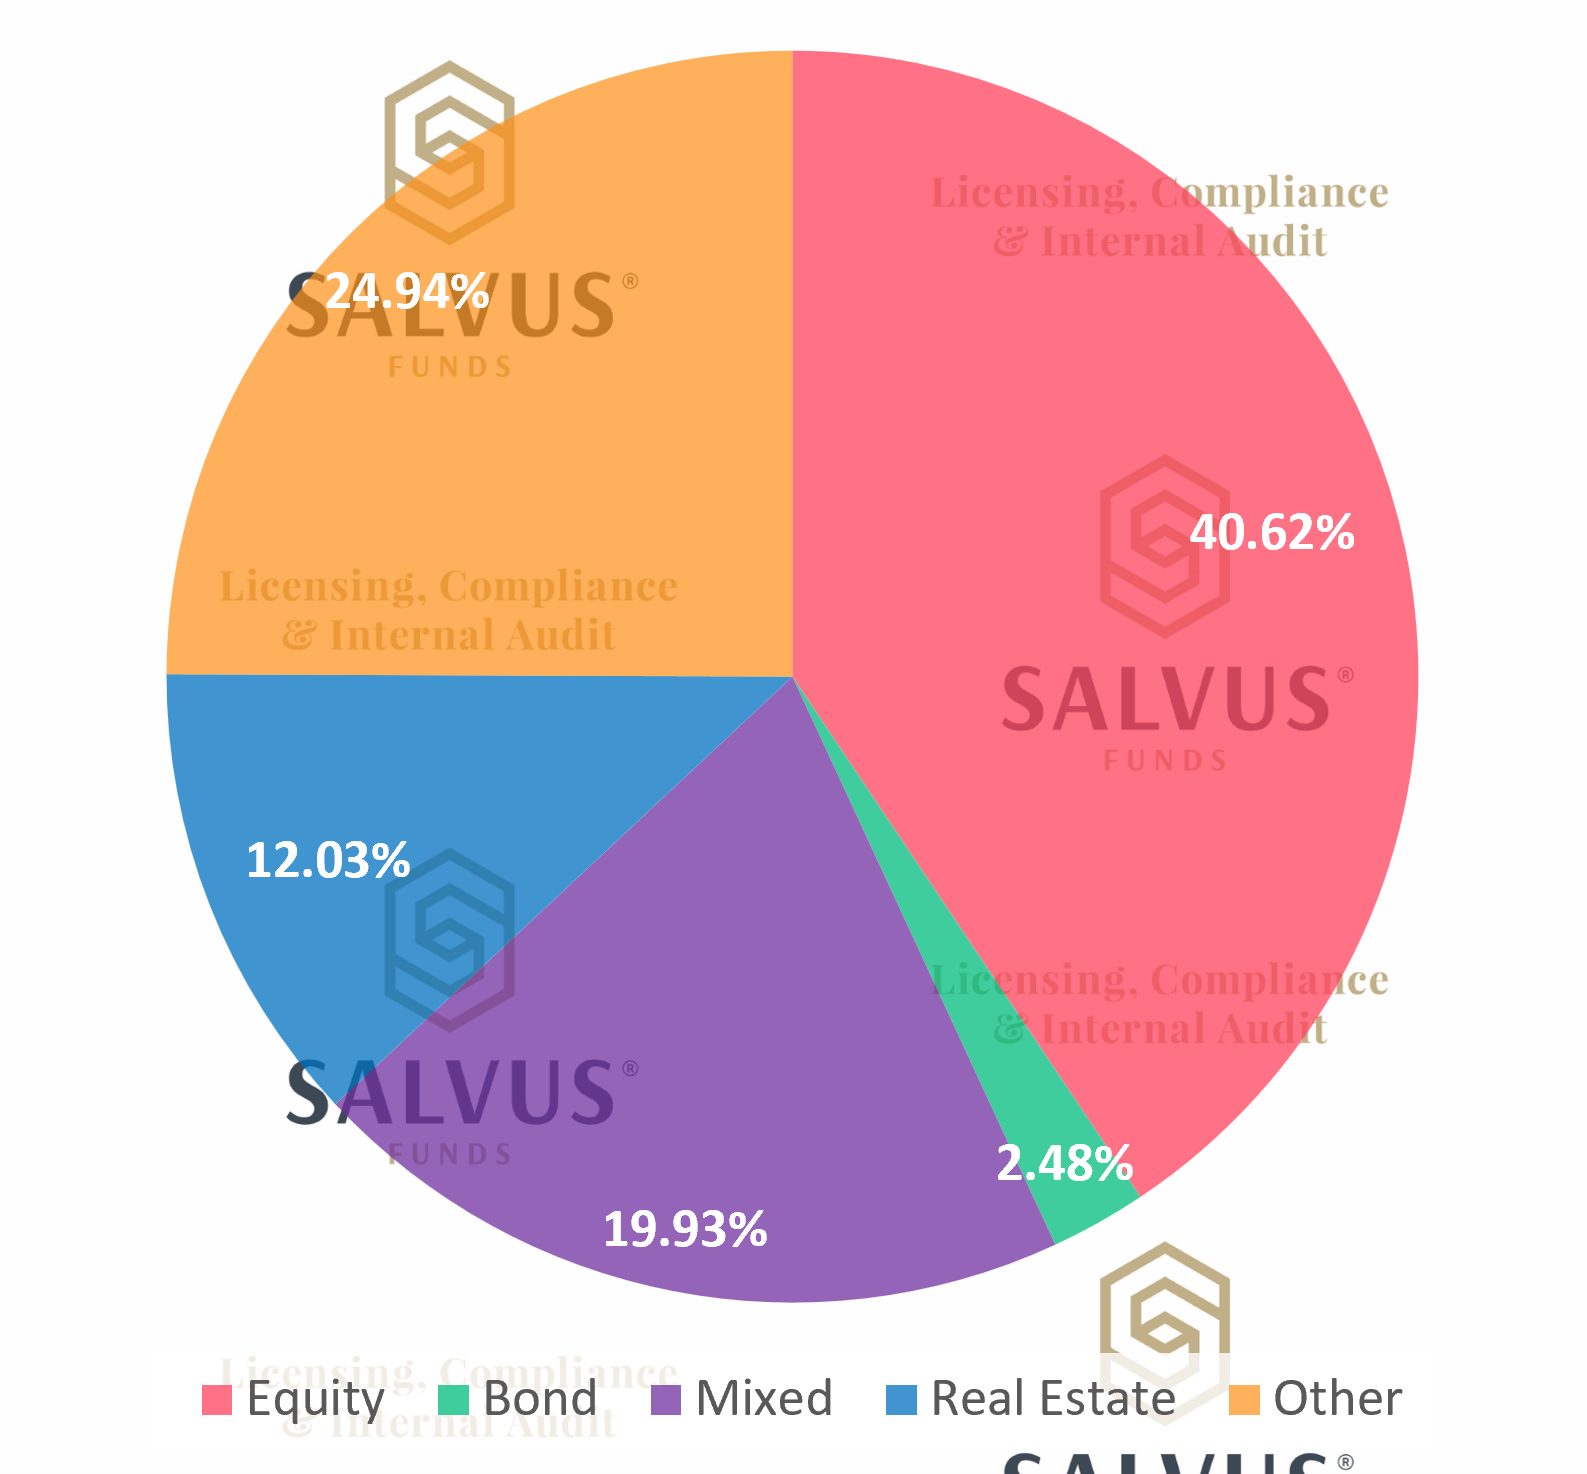
The third section of the Investment Funds Statistics report by the CBC for Cyprus in Q4 of 2023 depicts the breakdown by nature of investment of the total assets/liabilities. In particular, the CBC demonstrates the figures through the following categories:
- Equity
- Bond
- Mixed
- Real Estate
- Other
The Mixed (purple in Fig. 2) category and Other (orange in Fig. 2) both saw the largest decreases in million EUR. Only the Real Estate (blue in Fig. 2) saw an increase in their metrics since the previous Q3 2023 report. Equity (red in Fig. 2) and Bond (green in Fig. 2) saw a slight decrease in their values quarter-over-quarter.

Figure 2 – The split between the Investment Funds total assets/liabilities by nature of investment as outlined by the Central Bank of Cyprus (CBC) within the Q4 2023 Investment Funds Statistics report.
4. The investment funds total assets/liabilities, by type of investment fund table
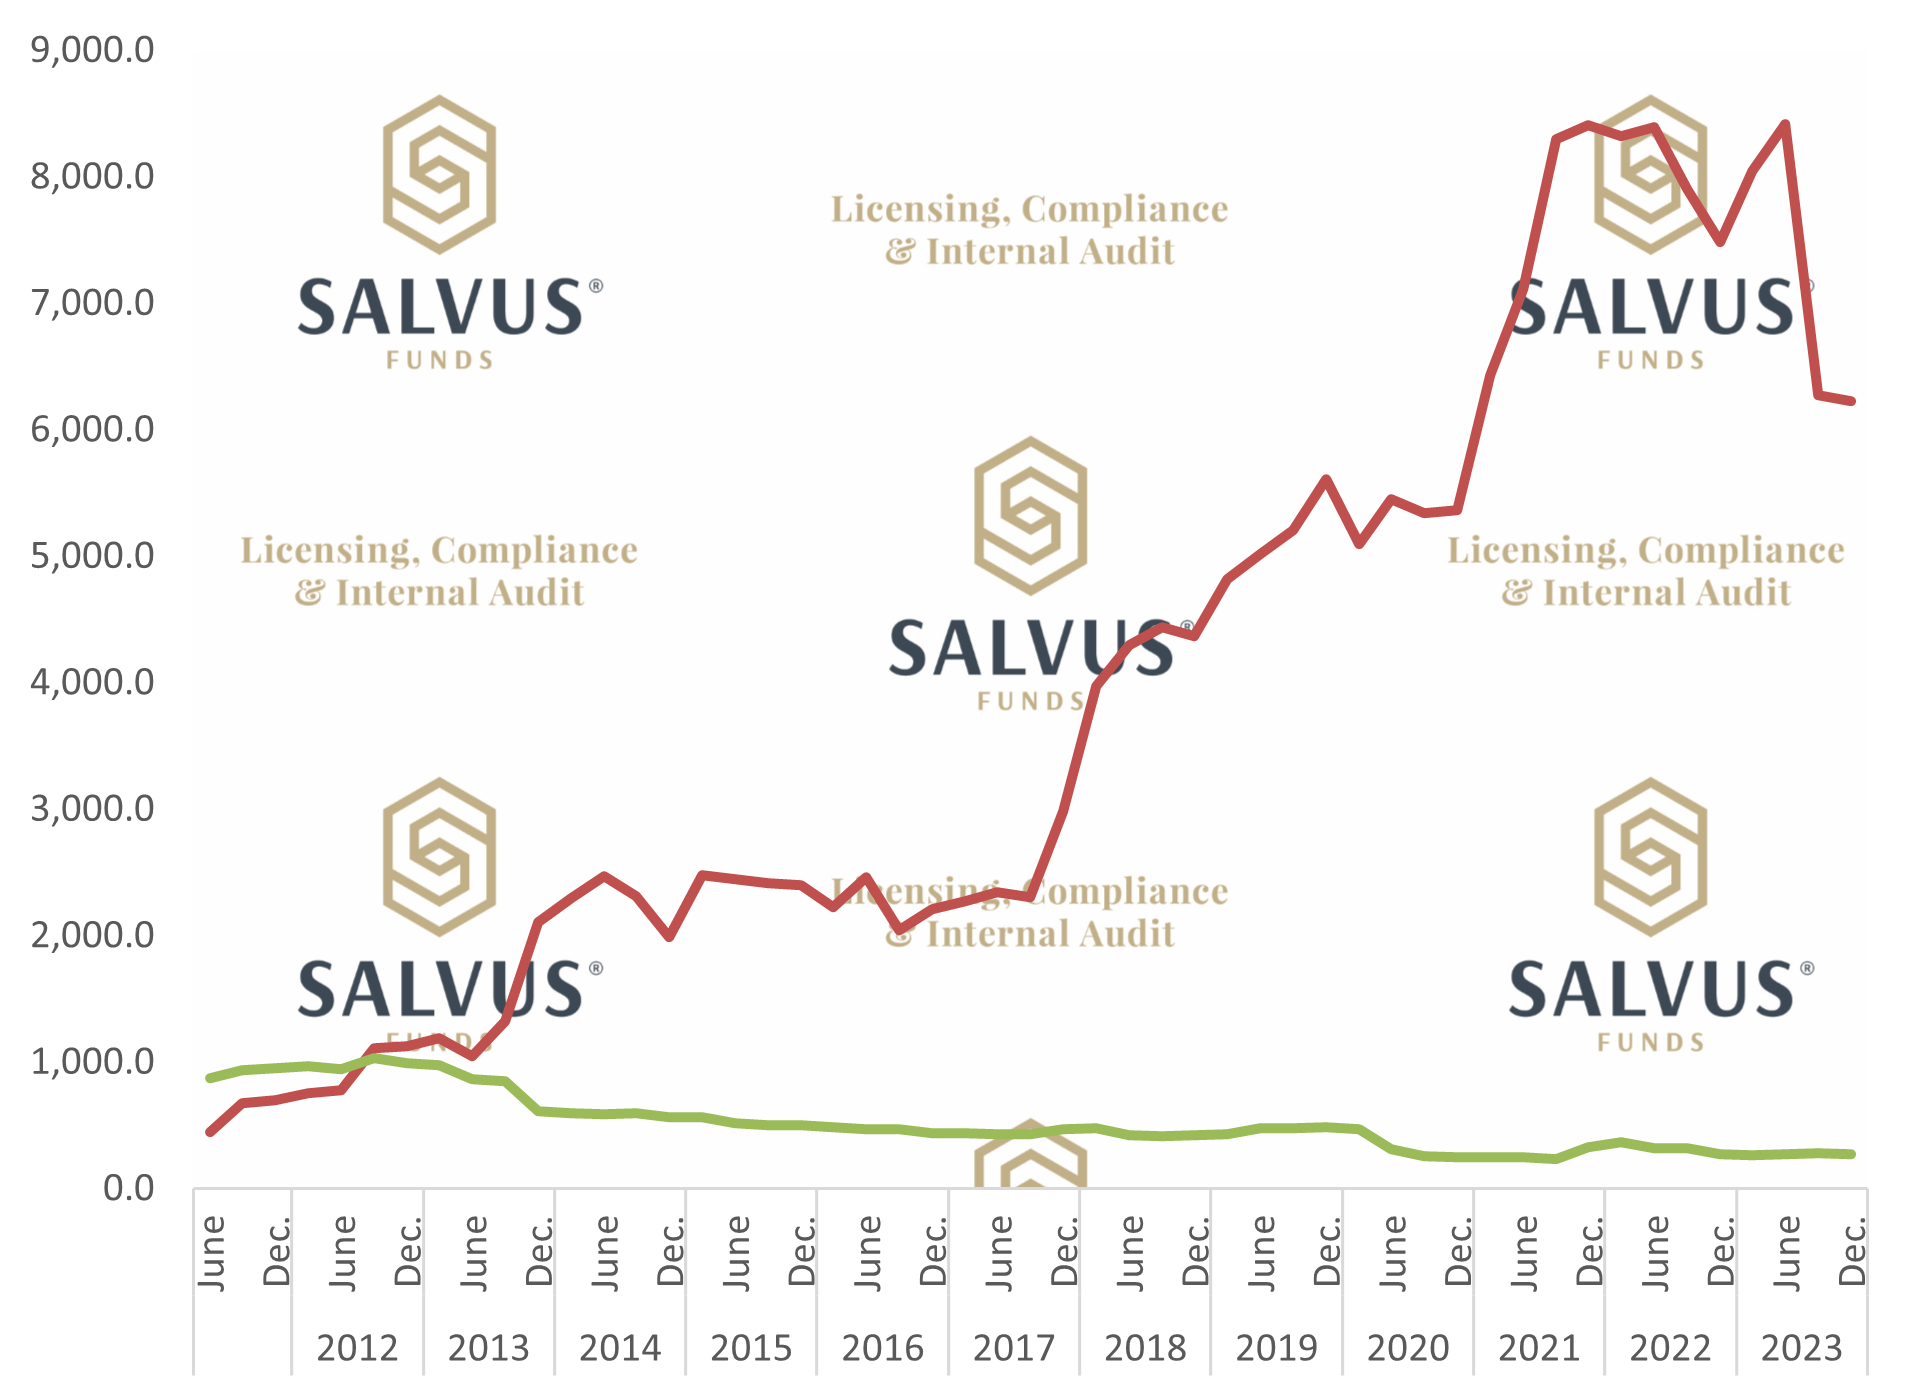
The CBC splits between Open End and Closed End fund types.
According to Figure 3, Close End (green line) Investment Funds recorded a 3.09% decrease in valuation quarter-over-quarter and now stands at 207.3 million EUR. The Open End (red line) continued its downward trend for a second consecutive quarter and now sits at 6,224.8 million EUR.

Figure 3 – The progress of the total assets/liabilities in EUR million (bars), outstanding at the end of the period broken down by type of investment fund.
5. The investment funds total assets/liabilities, UCITS/Non-UCITS breakdown table
The final section of the CBC reports the total assets/liabilities for UCITS and Non-UCITS investment funds. For Q4 2023, the consistent gap between the two categories continues. UCITS recorded its 5th consecutive increase however, Non-UCITS continued to fall and currently stands at 5,985.9 million EUR.
Conclusion
Despite a second consecutive decrease in total assets reported in the Q4 2023 CBC Investment Funds Statistics report, as SALVUS we choose to remain optimistic about the long-term growth and success of the investment funds industry in Cyprus.
The hard work of CySEC (the investment funds regulator in Cyprus) and the work of the dedicated investment fund association (CIFA) in Cyprus, is helping attract new business to Cyprus.
Furthermore, we look forward to continue adding value and positively impacting the investment funds industry by assisting investment funds to obtain authorisations, and comply with regulations within the financial ecosystem in Cyprus and around the globe.
Contact us at info@salvusfunds.com to learn how we can help set up your investment fund in Cyprus or to learn more about the Cypriot investment services ecosystem.
#StayAhead
Should you be interested to read about relevant topics in the funds sector, feel free to visit our earlier articles:
- AIFMs, UCITs and the Liquidity stress Tests (LST)
- Is it all gloom and doom for hedge funds returns (YTD)?
- The Reasons AIFM, AIF and RAIF come to Cyprus
- The Cypriot AIF: legal forms, types and requirements
- The Cypriot RAIF: substance, requirements and tax
- Cyprus Investment Funds Statistics – September, 2023
- Cyprus Investment Funds Statistics – June, 2023
- Cyprus Investment Funds Statistics – March, 2023
- Cyprus Investment Funds Statistics – December, 2022
- Cyprus Investment Funds Statistics – September, 2022
- Cyprus Investment Funds Statistics – June, 2022
- Cyprus Investment Funds Statistics – March, 2022
- Cyprus Investment Funds Statistics – December, 2021
- Cyprus Investment Funds Statistics – September, 2021
- Cyprus Investment Funds Statistics – June, 2021
- Cyprus Investment Funds Statistics – March, 2021
- Cyprus Investment Funds Statistics – December, 2020
- Cyprus Investment Funds Statistics – November, 2020
- Cyprus Investment Funds Statistics – August, 2020
- Cyprus Investment Funds Statistics – May, 2020
- Cyprus Investment Funds Statistics – February, 2020
The information provided in this article is for general information purposes only. You should always seek professional advice suitable to your needs.

