
Cyprus Investment Funds Statistics – December 2024
On the 19th of February 2025, the Statistics Department at the Central Bank of Cyprus (CBC) released the latest statistics update concerning the investment funds industry in Cyprus. The CBC’s investment funds statistics report covers the fourth quarter (Q4) of 2024.
The SALVUS Investment Funds Licensing team regularly publishes an article such as this one to demonstrate the Cypriot investment funds statistics for the previous quarter in a digestible manner. Throughout the summary, our team highlights the key trends within the sector.
As active members of the Cyprus Investment Funds Association (CIFA) Statistics and Fund Research Committee, along the Cyprus Securities and Exchange Commission (CySEC), the CBC, and the Cyprus Stock Exchange (CSE), we participate in the collection, preparation, and submission of comprehensive statistical data on the investment funds industry in Cyprus, reporting to the European Securities and Markets Authority (ESMA) and European Fund and Asset Management Association (EFAMA).
Throughout this article, our Investment Funds Licensing team presents the statistics in more depth through the sections below:
1. Investment Funds balance sheet data: assets,
2. Investment Funds balance sheet: liabilities,
3. Investment Funds total assets/liabilities, by nature of investment,
4. Investment Funds total assets/liabilities, by type of investment fund,
5. Investment Funds total assets/liabilities, UCITS/Non-UCITS breakdown.
6.Alternative Investment Funds (AIF) net assets, by nature of investment.
We regularly share bite-sized insights on LinkedIn such as those found in this article
1. The investment funds balance sheet data: assets table
At the end of December 2024, the CBC reported the total assets outstanding for the investment funds industry in Cyprus at 7,369.5 million EUR. This represents a 8.44% increase from the 6,795.5 million EUR total assets reported at the end of September 2024. The latest report represents the first major increase since the end of June 2023. Additionally, the number of reporting entities increased quarter-over-quarter, reaching a total of 338 reporting entities – 4 more than previously reported at the end of September 2024.
Figure 1 below, combines the 2 aforementioned data sets with
- the y-axis on the left and the gold bars along the x-axis showing the Total Assets in EUR million, outstanding,
- the y-axis on the right and the red line along the x-axis showing the Number of Reporting Entities, at the end of each period
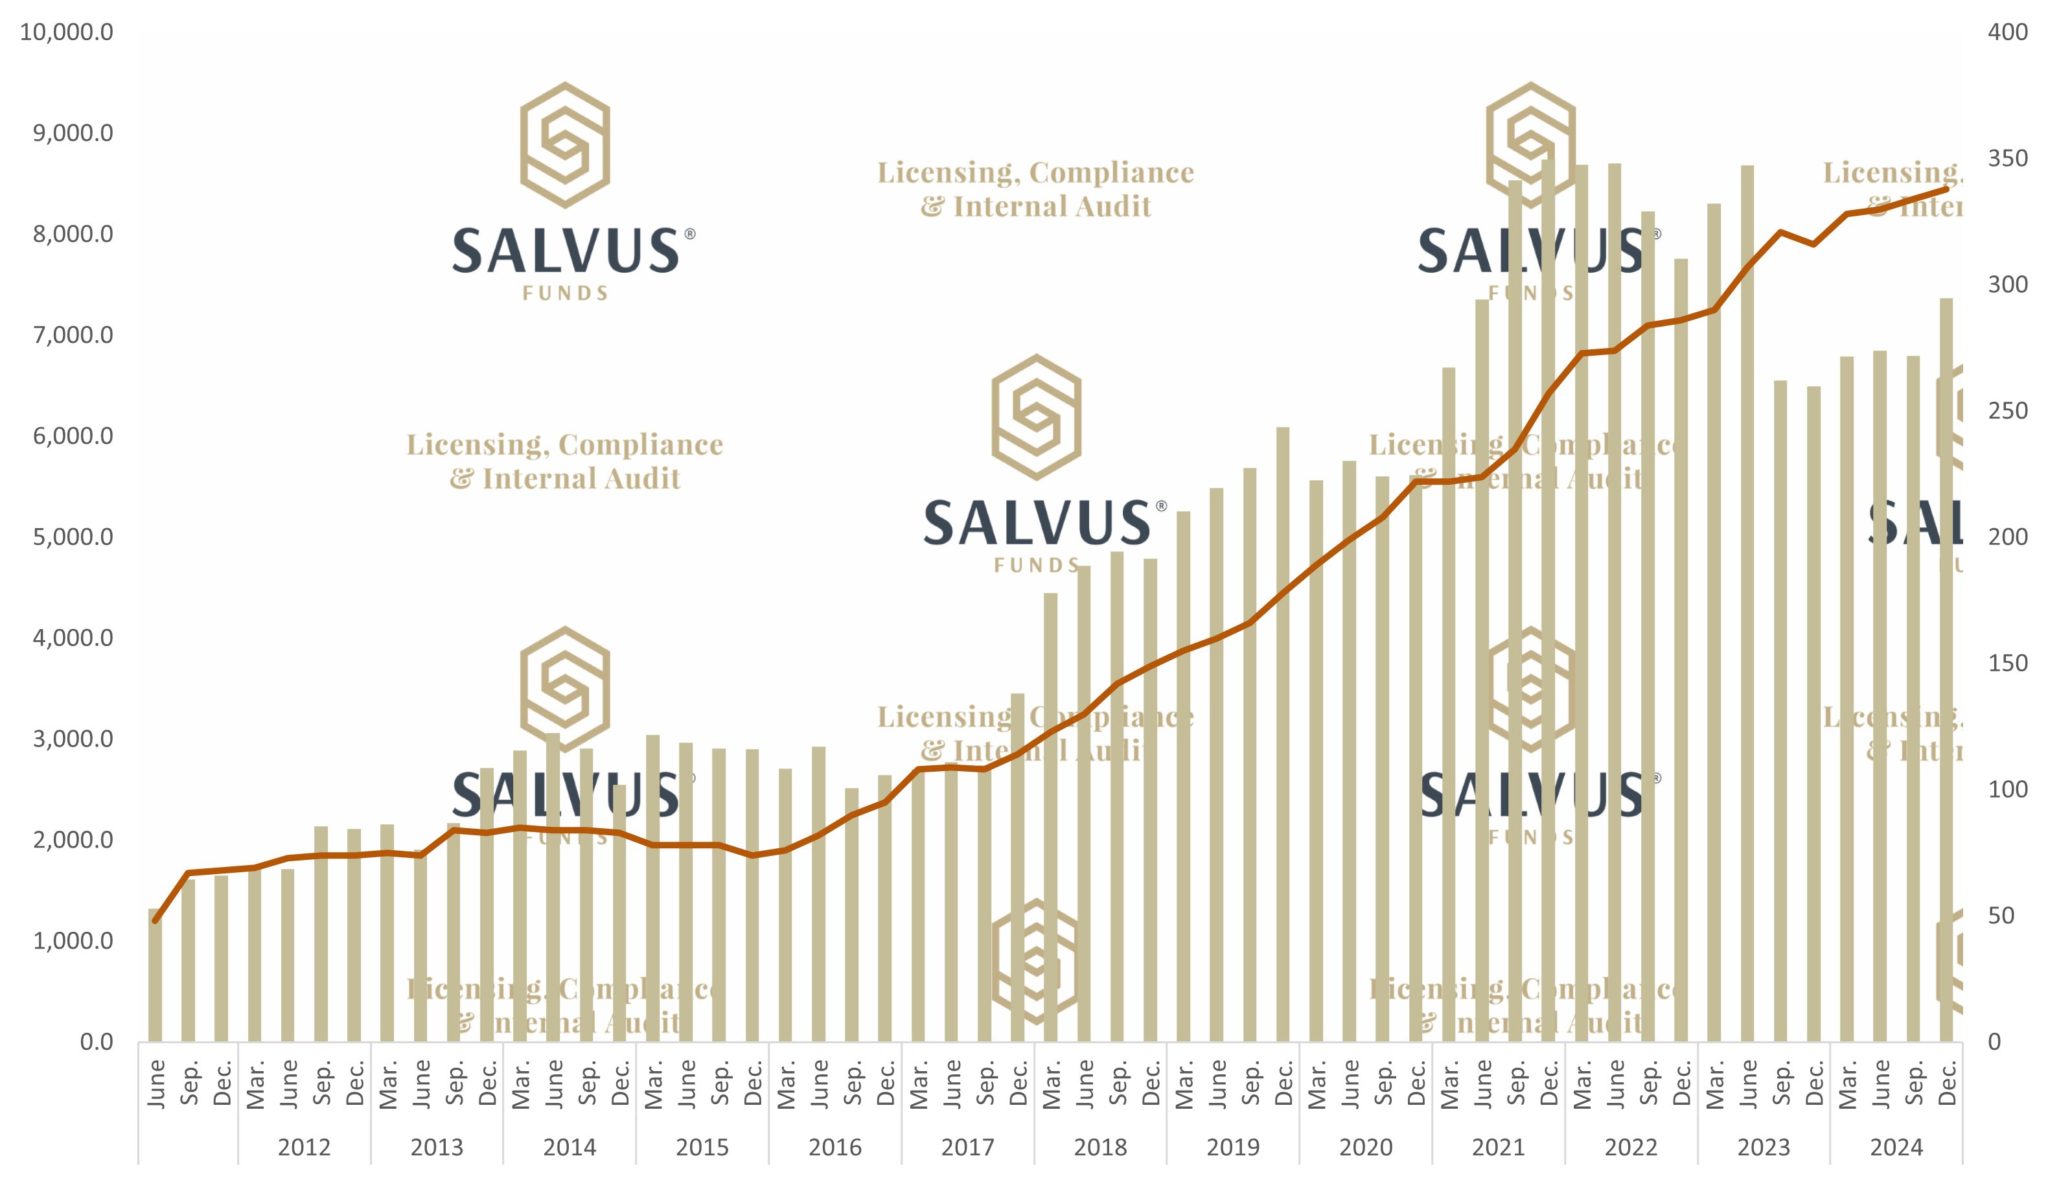
Figure 1 – The progress of Total Assets in EUR million (bars), outstanding at the end of the period and the Number of Reporting Entities (line) from the end of June 2011 until the end of December 2024.
2. The investment funds balance sheet data: liabilities table
In the next section, the CBC uses 3 segments to categorise the liabilities on the balance sheet of the investment funds in Cyprus:
- Loans
- IF (Investment Funds) shares/units
- Other liabilities (incl. financial derivatives)
IF shares/units have continuously dominated the liabilities of Cypriot investment funds and it is no different this time around either. IF shares/units contribute to 96.40% of the total liabilities. Loans and Other liabilities (incl. financial derivatives) make up the remainder of the total liabilities with 1.31% and 2.30%, respectively.
3. The investment funds total assets/liabilities, by nature of investment table
The third section of the Investment Funds Statistics report by the CBC for Cyprus in Q4 of 2024 depicts the breakdown by nature of investment of the total assets/liabilities. In particular, the CBC demonstrates the figures through the following categories:
- Equity
- Bond
- Mixed
- Real Estate
- Other
All categories saw an increase in million EUR. Among the five categories, the most notable increase was in Equity (red in Fig. 2), which experienced the largest major increase, at 50.24% after consecutive increases in value quarter-over-quarter.
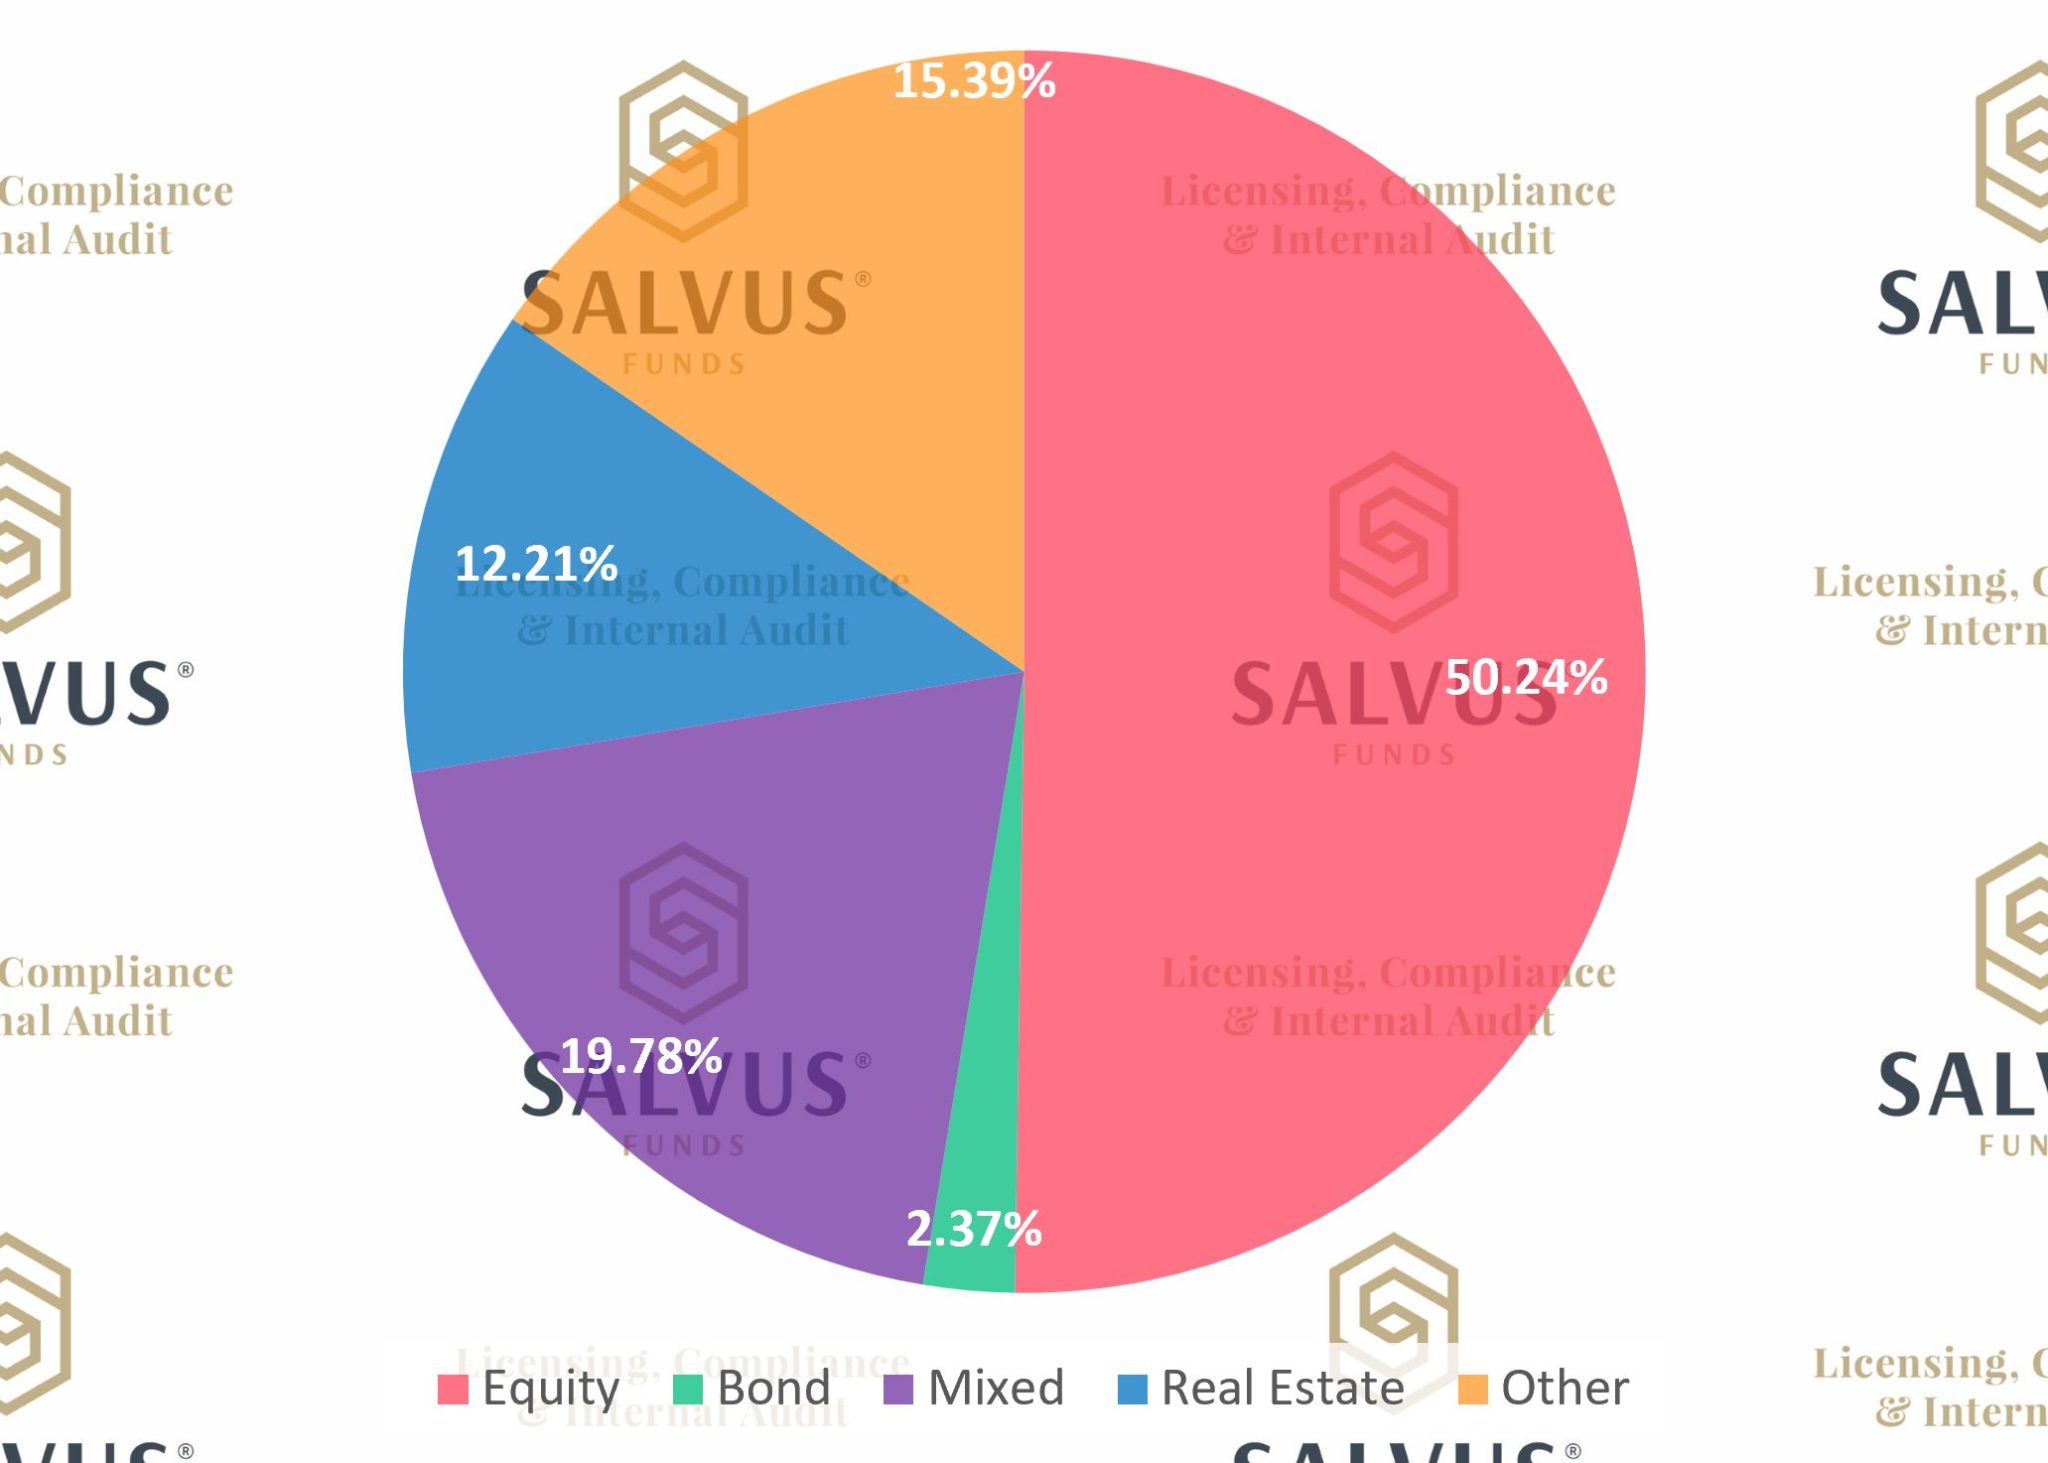
Figure 2 – The split between the Investment Funds total assets/liabilities by nature of investment as outlined by the Central Bank of Cyprus (CBC) within the Q4 2024 Investment Funds Statistics report.
4. The investment funds total assets/liabilities, by type of investment fund table
The CBC splits between Open End and Closed End fund types.
According to Figure 3, Open End (red line) Investment Funds recorded an increase of 8.50% in valuation quarter-over-quarter and now stands at 7,036.1 million EUR. The Close End (green line) marks the second consecutive increase after the last quarter’s first increase and now sits at 33.4 million EUR.
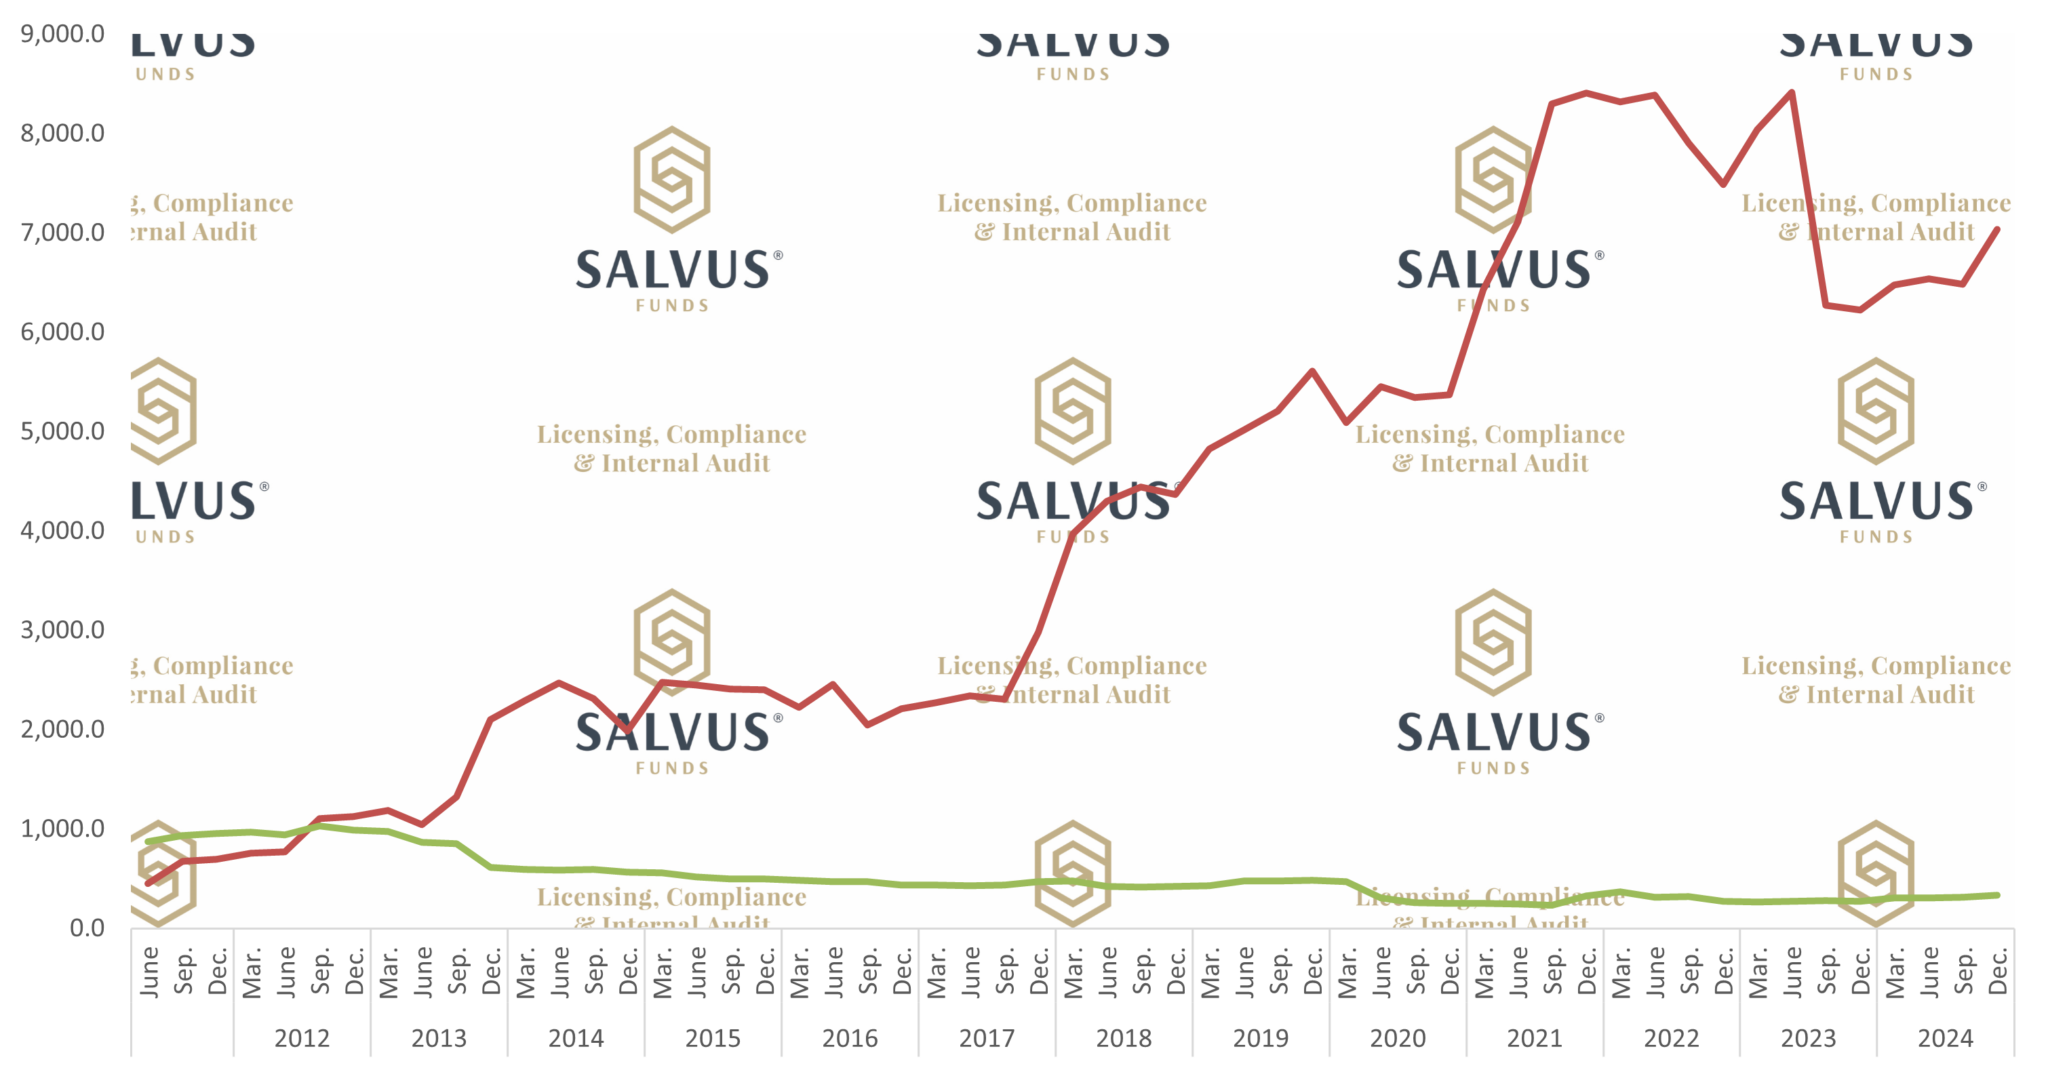
Figure 3 – The progress of the total assets/liabilities in EUR million (bars), outstanding at the end of the period broken down by type of investment fund.
5. The investment funds total assets/liabilities, UCITS/Non-UCITS breakdown
This section of the CBC reports the total assets/liabilities for UCITS and Non-UCITS investment funds. For Q3 2024, the consistent gap between the two categories continues. UCITS recorded its first decrease after 8 consecutive increases, while Non-UCITS had a clear increase of 9.42% and currently stands at 6,744.3 million EUR.
6. The alternative investment funds net assets, by nature of investment data
In respect to the data reported to EFAMA this section depicts the breakdown by nature of investment of the net assets of AIF including Registered AIF in Q4 2024 compared to Q3 2024 (Fig 4). In particular, the figures are demonstrated through the following categories:
- Equity
- Bond
- Mixed
- Real Estate
- Other
All categories saw an increase in million EUR as opposed to the third quarter of 2024, with the most notable increase of 48.12% being in Other, and currently stands at 3116 million EUR. It is identified that Other Investments steadily occupy the largest portion of AIF net assets. However, during the last quarter of 2024, we noted a slight decrease in entities, noting one less that Q3 3034, now being at 435.
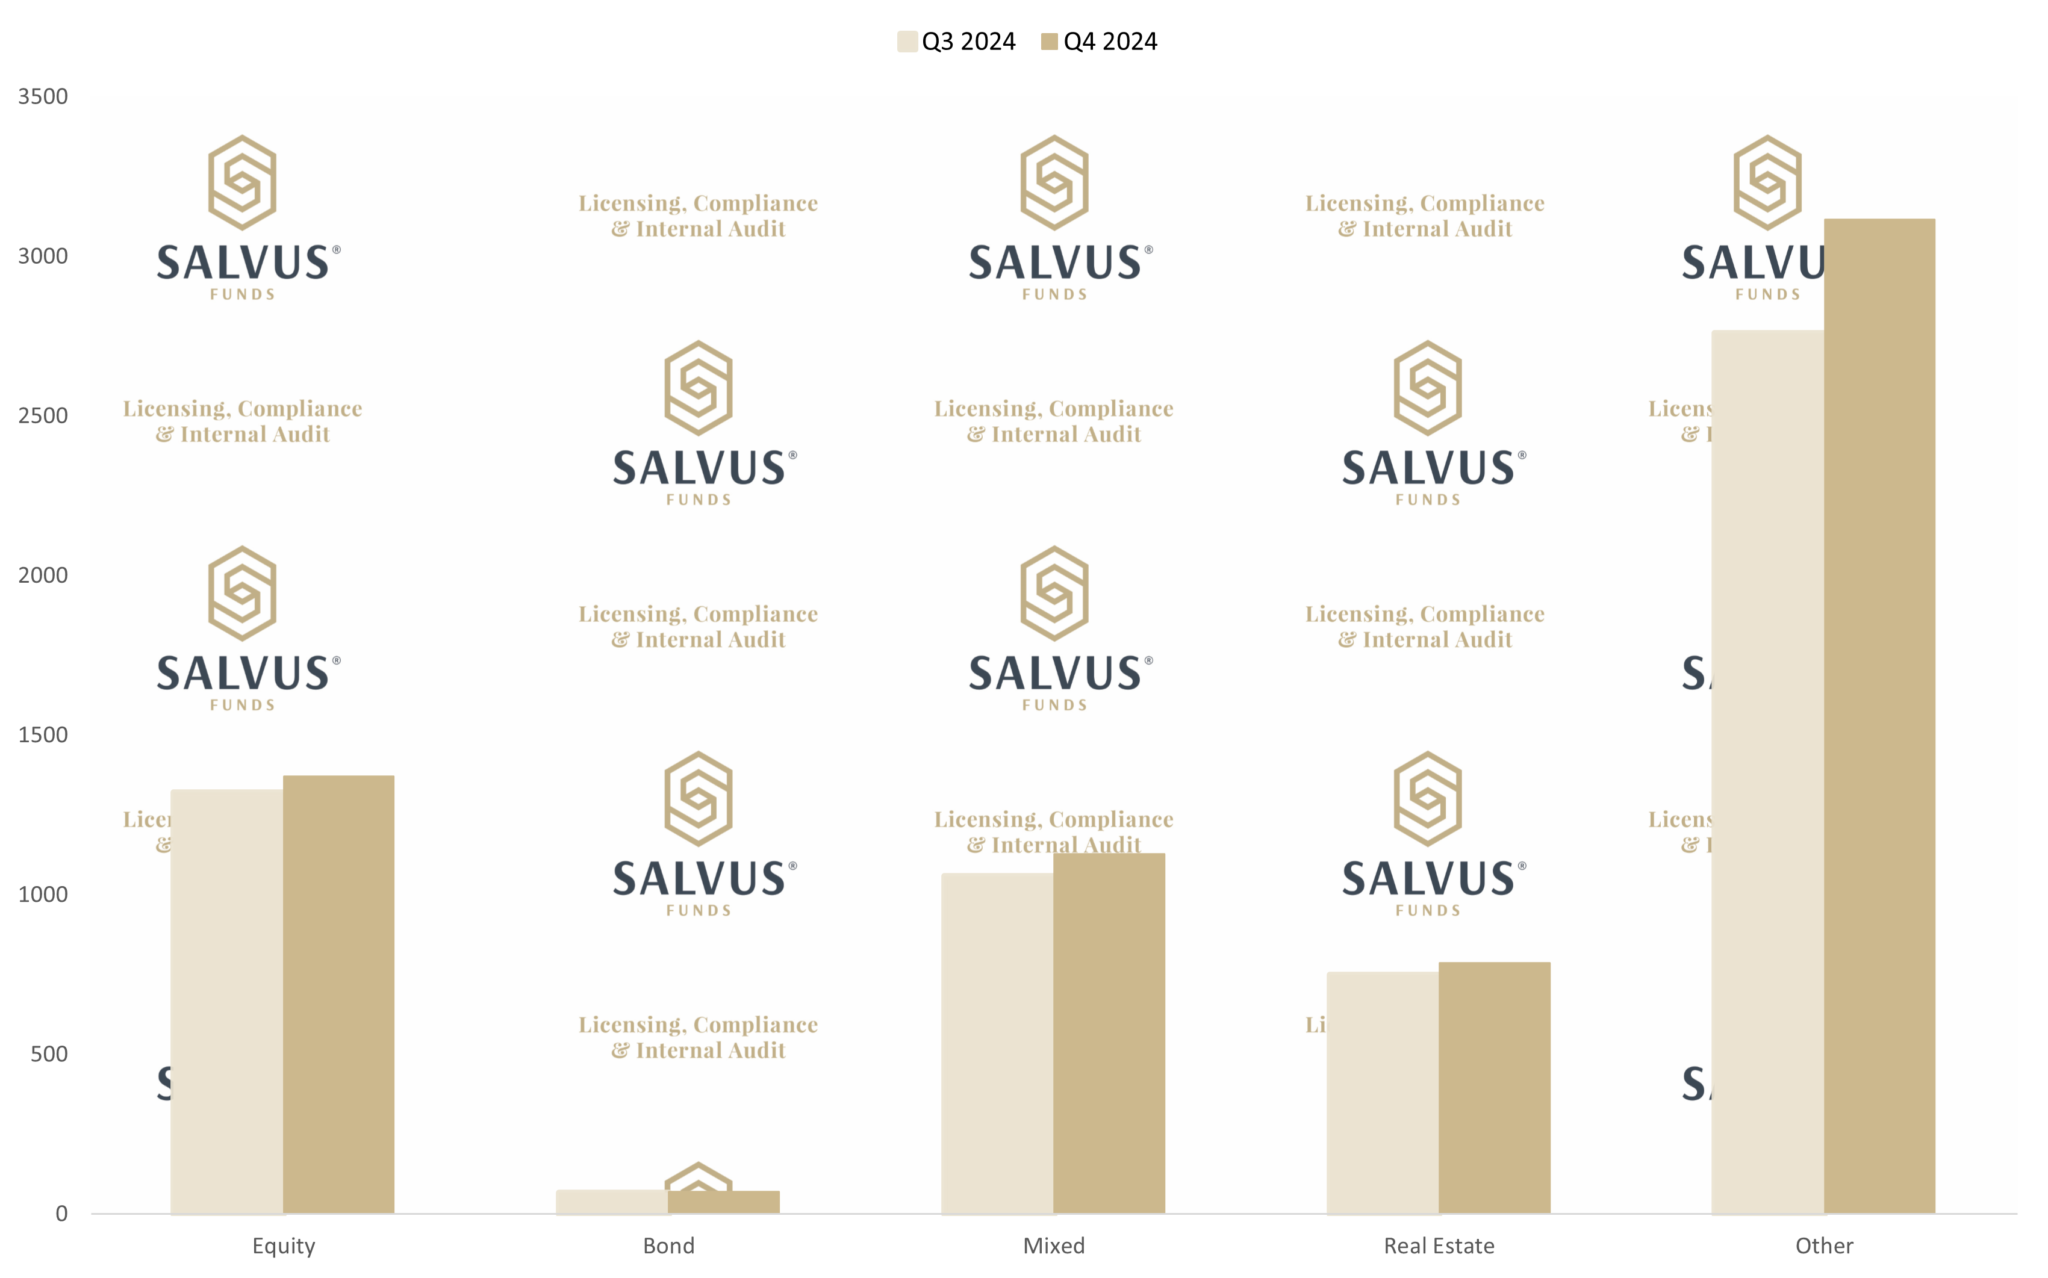 Figure 4 – The split between the AIF net assets, by nature of investment as reported to the European Fund and Asset Management Association (EFAMA) by the end of the third (light gold bar) and fourth (dark gold bar) quarters of 2024.
Conclusion
As SALVUS, we are satisfied with the CBC’s Cypriot Investment Funds Statistics report and the data reported to EFAMA for Q4 2024. Despite the challenging economic conditions and the looming threat of a potential recession, the investment funds industry in Cyprus continues to attract increasing capital inflows, demonstrating resilience.
The hard work of CySEC (the investment funds regulator in Cyprus) and the work of the dedicated investment fund association (CIFA) in Cyprus, is helping attract new business to Cyprus.
Furthermore, we look forward to continue adding value and positively impacting the investment funds industry by assisting investment funds to obtain authorisations, and comply with regulations within the financial ecosystem in Cyprus and around the globe.
Contact us at info@salvusfunds.com to learn how we can help set up your investment fund in Cyprus or to learn more about the Cypriot investment services ecosystem.
#StayAhead
Should you be interested to read about relevant topics in the funds sector, feel free to visit our earlier articles:
- AIFMs, UCITs and the Liquidity stress Tests (LST)
- Is it all gloom and doom for hedge funds returns (YTD)?
- The Reasons AIFM, AIF and RAIF come to Cyprus
- The Cypriot AIF: legal forms, types and requirements
- The Cypriot RAIF: substance, requirements and tax
- Cyprus Investment Funds Statistics – March 2024
- Cyprus Investment Funds Statistics – June 2024
- Cyprus Investment Funds Statistics – September 2024
- Cyprus Investment Funds Statistics – December 2023
- Cyprus Investment Funds Statistics – September, 2023
- Cyprus Investment Funds Statistics – June, 2023
- Cyprus Investment Funds Statistics – March, 2023
- Cyprus Investment Funds Statistics – December, 2022
- Cyprus Investment Funds Statistics – September, 2022
- Cyprus Investment Funds Statistics – June, 2022
- Cyprus Investment Funds Statistics – March, 2022
- Cyprus Investment Funds Statistics – December, 2021
- Cyprus Investment Funds Statistics – September, 2021
- Cyprus Investment Funds Statistics – June, 2021
- Cyprus Investment Funds Statistics – March, 2021
- Cyprus Investment Funds Statistics – December, 2020
- Cyprus Investment Funds Statistics – November, 2020
- Cyprus Investment Funds Statistics – August, 2020
- Cyprus Investment Funds Statistics – May, 2020
- Cyprus Investment Funds Statistics – February, 2020
The information provided in this article is for general information purposes only. You should always seek professional advice suitable to your needs.